Your team's week,
read in 60 seconds.
Point TeamWeather at a GitHub repo or org and get a plain-language verdict — "flow looks steady, here are the 1–2 things worth your attention" — instead of a wall of charts.
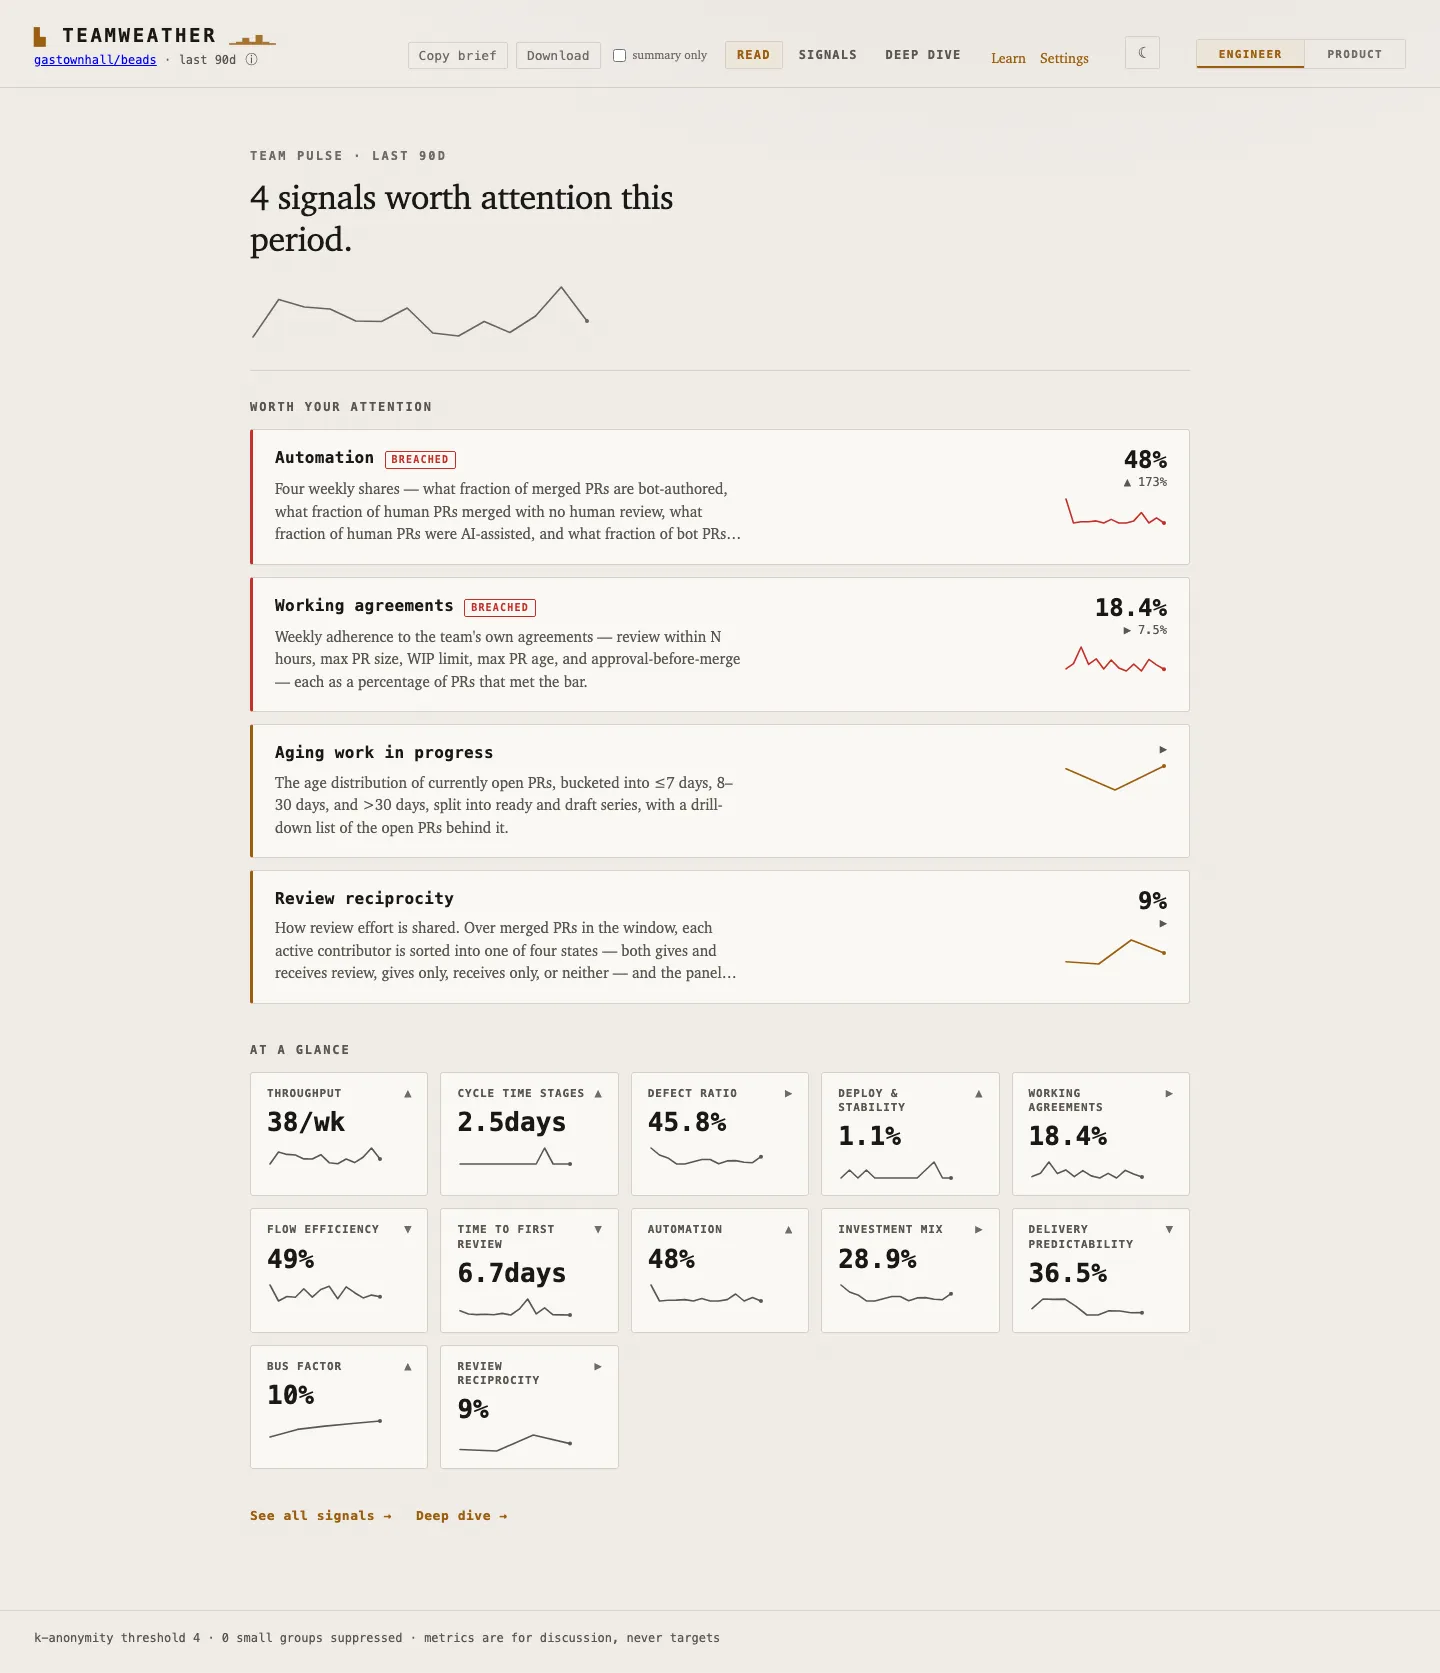
Lead with the Read, not the charts
The landing view is an opinionated Read: a top-line verdict, a short ranked list of what's worth your attention this week, and at-a-glance vitals that say when flow is steady. It's built to start a conversation with your team, not to hand you homework.
- The verdict
- One plain-language line on how flow looks this week — steady, or worth a closer look.
- Worth your attention
- The 1–2 signals that changed, ranked — each with a quality counterweight so speed is never read alone.
- Deep dive, on demand
- 20+ detailed metrics — cycle-time stages, throughput, flow efficiency, review concentration, bus-factor, codebase hotspots — one click away when you want them, never in your face when you don't.
Blame-proof by architecture, not by promise
- Team and area rollups only — no panel names, ranks, or scores an individual.
- k-anonymity: groups too small to be anonymous are suppressed, not shown.
- Every speed metric ships beside a quality counterweight — a faster number is never read alone.
- Bots and service accounts are excluded from human-flow metrics, once, at ingest.
- Metrics are for discussion, never targets. It is not a DORA dashboard and not a surveillance tool.
Runs locally, owns nothing of yours
A single CLI: sync a repo or an org and get a self-contained static dashboard bundle you can serve or host anywhere. Your data stays in a local SQLite file, re-derivable from GitHub at any time. It also emits a machine-readable analysis brief (JSON) for AI agents. Free, fully functional offline — no API key required.